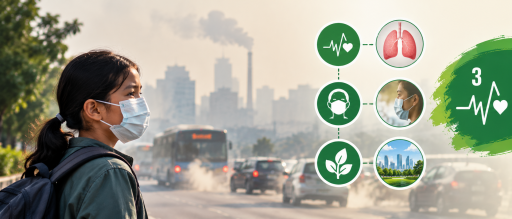
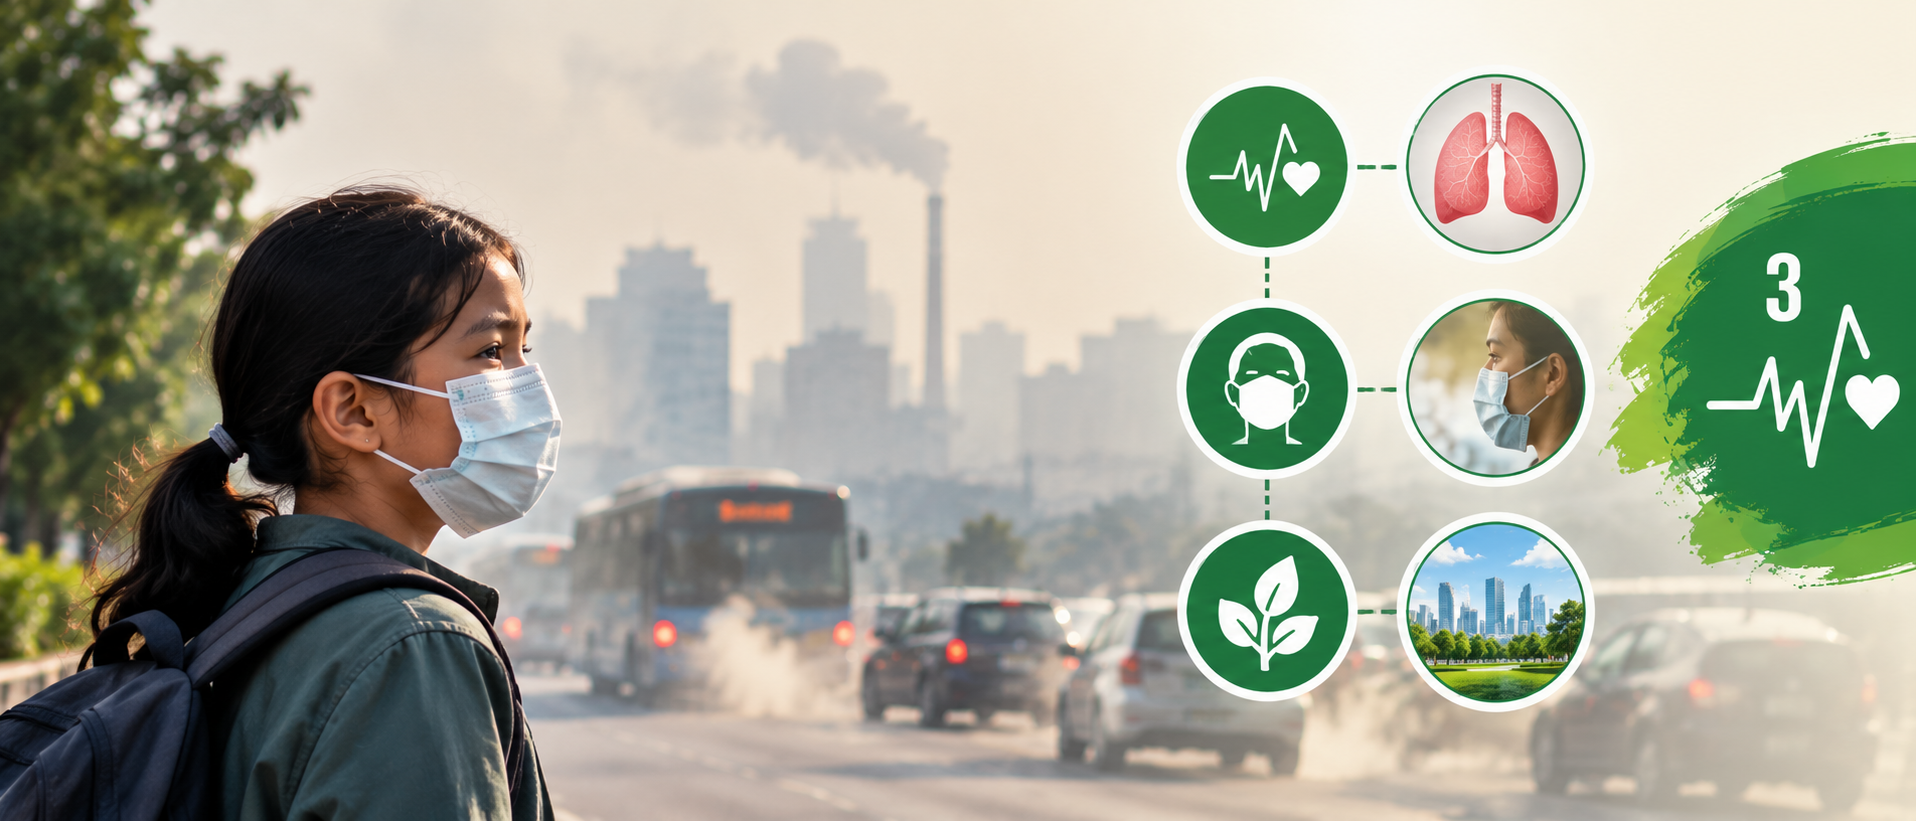
Every breath connects the environment to human health. That is why air pollution and health sit at the center of SDG 3, the global goal to ensure healthy lives and wellbeing for all.
The scale is hard to overstate. WHO data show that 99% of the world’s population lives in places where air pollution exceeds WHO guideline limits [1]. Together, ambient and household air pollution caused an estimated 6.6 million deaths in 2021 [1].
Other estimates run higher. The Health Effects Institute’s State of Global Air 2025 report attributes 7.9 million deaths in 2023 to air pollution. That is about 1 in 8 deaths worldwide, making it the second leading risk factor for death after high blood pressure [2].
Air pollution is both an environmental and a public health challenge. It also links directly to disease prevention and quality of life. Cleaner air means fewer heart attacks, strokes, lung diseases, and cancers. It also means more years lived in good health.
SDG target 3.9 calls on countries to substantially reduce deaths and illnesses from air, water, and soil pollution by 2030 [3]. Indicator 3.9.1 tracks deaths attributed to household and ambient air pollution [3].
This guide explains the health effects, the economic cost, the main sources, and the solutions that work. For wider context, see our overview of SDG 3: Good Health and Wellbeing.
Health Effects of Air Pollution
What the evidence shows
Fine particulate matter (PM2.5) is the pollutant with the strongest evidence of harm. These tiny particles travel deep into the lungs and enter the bloodstream. In some cases, they can cross the blood brain barrier [2].
WHO estimates that ambient air pollution caused 4.2 million premature deaths in 2019. The disease breakdown shows how wide the damage reaches [4]:
- Ischaemic heart disease and stroke: 68% of deaths
- Chronic obstructive pulmonary disease: 14%
- Acute lower respiratory infections: 14%
- Lung cancer: 4%
Noncommunicable diseases account for 86% of air pollution deaths globally [2]. Newer evidence also links polluted air to the brain. The State of Global Air report attributes 626,000 dementia deaths in 2023 to air pollution, a 98% increase since 2000 [2].
Air Pollution and Health: short term and long term exposure
Exposure affects people differently over time.
- Short term exposure: Pollution peaks can aggravate asthma, heart disease, and lung disease. This is why cities issue high pollution alerts and warn people with existing conditions [6].
- Long term exposure: Years of breathing polluted air raise the risk of chronic disease. Chronic exposure contributes to cardiovascular and respiratory disease and lung cancer [5].
Because chronic diseases develop slowly, most deaths appear in older adults. Among people over 60, air pollution caused 5.8 million noncommunicable disease deaths [2].
Who faces greater risks
Some groups carry a heavier burden.
- Children: In 2023, more than 675,000 deaths among children under five were linked to air pollution. About 61 million healthy years of life were lost in this age group [2].
- Young children and household smoke: UNEP reports that more than 50% of premature pneumonia deaths among children under five are caused by particles from household air pollution [5].
- Older adults: Chronic disease risks build with age, and most air pollution deaths occur in later life [2].
- People with existing conditions: Older people, children, and people with pre existing health conditions are more sensitive to pollution [6].
The Economic Cost of Air Pollution
Air pollution drains economies in several ways. Illness raises healthcare spending. Sick leave and reduced productivity cut output. Premature deaths remove workers and income.
Households feel this directly. When a parent falls ill, children may miss school and relatives may leave work to give care. Employers lose skills and continuity.
The World Bank has put a number on the total. In 2019, the global cost of health damages from PM2.5 air pollution was US$8.1 trillion. That equals 6.1% of global GDP [7].
The same report found that household air pollution alone cost about US$1.67 trillion, or 1.3% of global GDP [7]. People in low and middle income countries are most affected by illness and death from air pollution [7].
Two points help interpret this figure:
- It values health damages from premature death and illness. That is broader than hospital bills.
- It is a modelled estimate for 2019, so it should be read as an order of magnitude.
Cleaning the air also has an economic return. A systematic review of air pollution control strategies found that nearly 70% of the reviewed studies reported economic benefits that outweighed costs [8].
Major Sources of Air Pollution
Outdoor and household air pollution
Two main types affect health. They have different sources and different solutions.
- Ambient (outdoor) air pollution: Pollution in the air outside, produced mainly by burning fuels in power plants, industry, vehicles, and by other sources such as waste and agricultural burning [4].
- Household air pollution: Smoke from cooking, heating, and lighting with solid fuels such as wood, crop waste, charcoal, coal, and dung, or with kerosene, in open fires and inefficient stoves [9].
Household air pollution caused about 3.2 million deaths in 2020, according to WHO [9]. In 2024, roughly 2.0 billion people still relied on polluting fuels and technologies for cooking [1].
The main emission sources
UNEP lists the major sources as follows [5]:
- Transport: Traffic, especially diesel vehicles. In European cities, road transport is responsible for up to 30% of particulate emissions.
- Industry: Sectors ranging from brick making to oil and gas production.
- Power generation: Coal fired and other combustion plants.
- Household fuels: Cooking and heating with solid fuels.
- Agricultural burning: Open burning of agricultural residues, along with forest fires and open waste burning.
The mix differs by region. WHO’s science and policy summaries note that household fuel use is the greatest source of human made PM2.5 in Africa. Industry emissions dominate in the Western Pacific Region. In the Americas, transport contributes the most, followed by agriculture [10].
How urbanisation and energy choices shape air quality
Cities concentrate traffic, industry, and heating, so pollution is usually higher in urban than in rural areas. Yet WHO’s 2026 data show that cities have achieved large reductions regardless of income level [11].
Energy choices matter most. WHO notes that most sources of outdoor air pollution are beyond individual control. They need action in energy, transport, waste, urban planning, and agriculture [4].
Rural areas tell a different story. In some low income countries, rural pollution levels are rising [11].
Air Pollution and Vulnerable Communities
Unequal exposure across income groups and places
Air pollution does not fall evenly. WHO’s 2026 data show that the number of people exposed to PM2.5 above the least strict interim target of 35 micrograms per cubic metre was 13 times higher in low and middle income countries than in high income ones [11].
The State of Global Air report adds that about 90% of air pollution deaths occur in low and middle income countries. Death rates in parts of Africa and South Asia were 5 to 10 times higher than in higher income regions [2].
Housing, work, and proximity to pollution sources
Inequality also appears within countries. The European Environment Agency (EEA) finds clear evidence that lower socio economic status means higher exposure to air pollution. In large parts of Europe, poorer people are more likely to live next to busy roads or industrial areas [6].
Even in wealthier regions with higher average NO2 levels, poorer communities tend to be exposed to higher local levels because they live closer to sources [12].
Progress can also be uneven. In Europe, pollutant concentrations fell by 36% in wealthier regions between 2009 and 2019. In poorer regions, they fell by only 25% [6].
Three factors drive these gaps:
- Housing: Cheaper housing is often located near busy roads, railways, and industry [12].
- Workplace exposure: Workers face particles, gases, and fumes on the job. WHO and the International Labour Organization (ILO) estimated that occupational exposure to particulate matter, gases, and fumes caused about 450,000 deaths in 2016 [14].
- Household fuels: Of the 2.0 billion people without clean cooking, 1.5 billion live in rural areas. About 970 million live in sub Saharan Africa [11].
The fix can create its own tension. The EEA notes that banning coal for home heating improved air quality in low income areas. However, the ban needs subsidies so that poorer households can switch to cleaner heating [13].
Technology and Air Quality Monitoring
Tools that reveal and reduce exposure
Technology makes invisible pollution visible. Four tools matter most.
- Air quality sensors: Low cost devices that measure PM2.5 and NO2 at street level.
- Satellite monitoring: WHO’s indicator for urban PM2.5 (SDG 11.6.2) uses a satellite product recalibrated with national monitoring data [11].
- Pollution forecasting: Models that predict high pollution days in advance.
- Real time public alerts: Warnings that tell residents and health professionals when to take precautions.
Governments can use this data to target traffic controls, plan clean air zones, and warn vulnerable people. Businesses can use it to find hotspots near sites and schedule high emitting activities carefully.
A documented real world example: Breathe London
London combines official monitors with a dense sensor network. Its Breathe London network adds over 400 hyper local sensors to the capital’s reference grade analysers. Community groups use it to monitor and manage local exposure [15].
London also runs a public air quality alert system. Between 2018 and 2023, it issued 19 high pollution alerts and 217 moderate alerts. In 2024, it began notifying health professionals directly [15].
The measurable results come from the monitoring itself. London’s data show roadside NO2 fell by 49% between 2016 and 2023 [15]. The next section explains the policies behind that fall.
Government Policies and Solutions
What works
WHO identifies proven policy options across sectors [4]:
- Industry: Clean technologies that cut smokestack emissions, plus better waste management.
- Energy and households: Affordable clean energy for cooking, heating, and lighting.
- Transport: Rapid urban transit, walking and cycling networks, and cleaner vehicles and fuels.
- Power generation: Low emission fuels and renewable sources such as solar, wind, and hydropower.
- Urban planning: Energy efficient buildings and compact, green cities.
- Restrictions on high polluting activities: Emission standards, controls on open waste burning, and limits on the most polluting vehicles and fuels.
Balancing health, development, and energy needs
Governments face real trade offs. Energy access, jobs, and growth matter, and so does public health.
The evidence suggests the choice is less stark than it appears. The World Bank puts the health damage from air pollution at 6.1% of global GDP [7]. Nearly 70% of reviewed studies found that control strategies delivered benefits above their costs [8].
Fair design also matters. As the EEA example shows, restrictions work best when paired with support for low income households to switch fuels [13].
A documented policy and its reported results: London’s Ultra Low Emission Zone
London introduced the world’s first 24 hour Ultra Low Emission Zone (ULEZ) in 2019 and expanded it London wide in 2023 [15]. Vehicles that do not meet emission standards pay a daily charge.
The reported results include:
- Central London (February 2017 to February 2020): Roadside NO2 fell by 44%, and PM2.5 fell by 27% [16].
- Inner London expansion: NO2 was estimated to be 46% lower in central London and 21% lower in inner London than it would have been without the scheme [17].
- Vehicle compliance: More than 95% of vehicles seen driving in London meet ULEZ standards, up from 39% in 2017 [15].
City Hall cautions that weather, seasonal changes, and atmospheric chemistry affect pollution readings. That is why it compares results with modelled scenarios without the policy [16].
A Case Study
China’s War on Air Pollution
What air pollution problem did China face?
By 2013, air pollution across China had reached record levels. Public awareness and criticism rose sharply [18]. WHO and national studies agree that the burden was heavy. One national analysis estimated that air pollution killed nearly 1 million people a year in China [20].
Which policies and interventions were introduced?
In September 2013, China launched its Air Pollution Prevention and Control Action Plan. It spanned energy, industry, transport, and legal and regulatory measures across more than 300 cities, at an estimated cost of about US$270 billion [20].
The plan set a target of cutting PM2.5 concentrations in cities by 10% to 25% by 2017 [20]. In 2014, Premier Li Keqiang declared a “war against pollution” [18].
What measurable changes were reported?
- Pollution levels: PM2.5 in China fell by 41% between 2013 and 2022 [18].
- Beijing: Pollution dropped by 54.1% in nine years, the largest decline of any province [18].
- Life expectancy: If the reductions are sustained, the average Chinese resident can expect to live about 2 years longer [18].
- Deaths (2013 to 2017): A peer reviewed analysis found that PM2.5 related deaths in 2017 were about 64,000 lower, or 6.8%, than in 2013 [20].
Over what period were results measured?
The main evaluation windows are 2013 to 2017, the plan’s first phase, and 2013 to 2022, the longer trend [18][20].
What limitations or criticisms remain?
- Still above guidelines: China’s average meets its national standard of 35 micrograms per cubic metre. That is far above the WHO guideline of 5. Particulate pollution still shortens average life expectancy by 2.3 years relative to the guideline [19].
- Slowing progress: The 2021 to 2022 decline was 3.4%, much slower than the early years [18].
- Deaths still rose over the long run: The same analysis found that deaths attributable to PM2.5 rose 36.1% between 2000 and 2017, driven partly by population ageing, even as the plan cut them [20].
- High cost: The plan was described as the largest air pollution control effort ever undertaken, at about US$270 billion [20].
China shows that fast progress is possible. It also shows that reaching WHO guideline levels takes sustained effort well beyond the first reduction.
Measuring Progress Toward SDG 3
How air pollution contributes to preventable disease and death
Air pollution is a leading preventable cause of noncommunicable disease. WHO estimates that 83% of air pollution deaths come from noncommunicable diseases such as heart disease, stroke, chronic lung disease, and lung cancer [21].
WHO tracks three linked SDG indicators [11]:
- SDG 3.9.1: Mortality rate attributed to household and ambient air pollution.
- SDG 7.1.2: Share of the population relying on clean fuels and technologies.
- SDG 11.6.2: Annual levels of fine particulate matter (PM2.5) in cities.
What the latest data show
WHO’s June 2026 data release reports [11]:
- PM2.5 levels dropped globally until 2020. Since then they have remained largely unchanged.
- Low and middle income countries bear 90% of the health impacts.
- Asia has the highest pollution levels but also the greatest progress. Africa, western Asia, and northern Africa have stayed essentially unchanged over the last decade.
- About 2.0 billion people still lack access to clean cooking. The deficit is growing in sub Saharan Africa and could reach 1 billion by 2027.
On deaths, WHO’s portal shows 6.6 million in 2021 [1]. The State of Global Air report shows 7.9 million in 2023 [2]. The two series use different methods and years, so they should not be added or compared directly.
WHO has set a target of cutting air pollution related mortality by 50% by 2040 [11]. These figures indicate that exposure is no longer falling globally, so current efforts are not enough to reach it.
Guideline versus legally binding standard
The two terms are often confused.
- An air quality guideline is a health based recommendation. WHO’s global guidelines set the maximum safe level for PM2.5 at an annual average of 5 micrograms per cubic metre or less [22]. They also offer interim targets to help countries move step by step [4].
- A legally binding national standard is a limit set in law. Governments decide it, weighing health with feasibility, and they enforce it. WHO notes that countries are responsible for implementing and monitoring air quality policies [4].
The gap between the two is large. More than 10% of the world’s population lives in areas with no air quality standards [2]. UNEP data, reported by the Clean Air Fund, show that only 9% of countries have PM2.5 standards that meet WHO guidelines [23].
London shows the difference in practice. The number of monitoring sites above the UK legal limit for NO2 fell from 56 in 2016 to 5 in 2023. Yet 2023 was only the first year that annual PM2.5 stayed below the latest interim WHO target at active sites [15]. Meeting a legal limit is not the same as meeting the guideline.
What Businesses Can Do
Businesses affect air quality through their operations, supply chains, and workplaces. Public policy sets the rules, but companies decide how well they perform within them.
Cleaner operations
- Cleaner production processes: Adopt clean technologies that reduce smokestack emissions and improve waste management, as WHO recommends for industry [4].
- Emissions monitoring: Measure emissions and nearby air quality so that problems are found early. The London guidelines require major developers to consider air quality impacts from the earliest design stage [15].
- Energy efficiency: Improve building and process efficiency. WHO lists energy efficient buildings among effective urban measures [4].
- Lower emission transport: Switch fleets to cleaner vehicles. London upgraded its entire bus fleet to meet or exceed ULEZ standards and added over 1,300 electric buses [15].
Protecting employees
Workers can face higher exposure than the general public. WHO and ILO estimated that about 450,000 deaths in 2016 were linked to occupational exposure to particulate matter, gases, and fumes. That is around 24% of all work related deaths [14].
Employers can respond in practical ways:
- Map exposure: Identify tasks that involve dust, fumes, or combustion.
- Monitor workplace air quality: Measure it and act on the results.
- Control at the source: Use ventilation, enclosure, and cleaner processes before relying on masks.
- Support vulnerable staff: Offer adjusted duties when pollution episodes occur.
Supply chains and transparent reporting
Responsible supply chain practices extend the effect. Companies can ask suppliers to measure and report emissions and switch to cleaner fuels. See our guide to sustainable supply chain management.
Transparent environmental reporting also matters. Companies can publish emissions, monitoring data, and reduction targets. Public data lets investors, communities, and regulators judge progress.
This article makes no claims about financial returns from these measures. Costs and benefits depend on the sector, location, and starting point. The strongest evidence applies to society as a whole, where nearly 70% of reviewed studies found benefits above costs for air pollution control [8].
For related ideas, read our posts on sustainable cities and communities and affordable and clean energy.
Conclusion
Clean air is essential to SDG 3. The evidence shows that air pollution and health are tightly linked. Dirty air drives heart disease, stroke, lung disease, cancer, and dementia, and it costs the global economy trillions of dollars.
Reducing pollution takes coordinated action. Governments set standards and enforce them. Businesses cut emissions and protect workers. Communities use data to demand cleaner air and to protect those most exposed.
The results are measurable. London cut roadside NO2 by 49% in seven years [15]. China cut PM2.5 by 41% in nine years [18]. Cleaner air means healthier populations and a stronger basis for sustainable economic development.
Yet global PM2.5 levels have been flat since 2020, and 99% of people still breathe air above WHO guideline levels [1][11]. Closing that gap is one of the clearest routes to achieving SDG 3.
References
- World Health Organization. Air pollution data portal. https://www.who.int/data/gho/data/themes/air-pollution
- Health Effects Institute (2026). Insights into the air we breathe: The State of Global Air 2025. https://www.healtheffects.org/announcements/insights-air-we-breathe-state-global-air-2025
- UNECE. SDG Indicator 3.9.1: Age standardized mortality rate attributed to household and ambient air pollution, Target 3.9. https://w3.unece.org/SDG/en/Indicator?id=96
- World Health Organization (24 October 2024). Ambient (outdoor) air pollution, fact sheet. https://www.who.int/news-room/fact-sheets/detail/ambient-(outdoor)-air-quality-and-health
- UNEP. UNEA 2 Fact sheet: Air pollution. https://wesr.unep.org/media/docs/assessments/Fact_sheet_air_pollution.pdf
- European Environment Agency. Air pollution and health. https://www.eea.europa.eu/en/analysis/publications/zero-pollution/health/air-pollution-and-health
- World Bank (2022). The Global Health Cost of PM2.5 Air Pollution: A Case for Action Beyond 2021. https://documents1.worldbank.org/curated/en/455211643691938459/pdf/The-Global-Health-Cost-of-PM-2-5-Air-Pollution-A-Case-for-Action-Beyond-2021.pdf
- The costs, health and economic impact of air pollution control strategies: a systematic review. https://pmc.ncbi.nlm.nih.gov/articles/PMC11337783/
- World Health Organization. Types of pollutants, Air quality, energy and health. https://www.who.int/teams/environment-climate-change-and-health/air-quality-and-health/health-impacts/types-of-pollutants
- World Health Organization. Air quality, energy and health: science and policy summaries. https://cdn.who.int/media/docs/default-source/air-pollution-documents/air-quality-and-health/who_sps_draft_27_3.pdf?sfvrsn=bb5924ba_3
- World Health Organization (29 June 2026). New SDG data shows stalled progress on air pollution and health. https://www.who.int/news/item/29-06-2026-new-sdg-data-shows-stalled-progress-on-air-pollution-and-health
- European Environment Agency. Environmental inequalities. https://www.eea.europa.eu/en/topics/in-depth/environmental-inequalities
- European Environment Agency. More action needed to protect Europe’s most vulnerable citizens from air pollution, noise and extreme temperatures. https://www.eea.europa.eu/highlights/protect-vulnerable-citizens
- WHO and ILO (2021). WHO/ILO Joint Estimates of the Work related Burden of Disease and Injury, 2000 to 2016. https://www.ilo.org/resource/news/whoilo-almost-2-million-people-die-work-related-causes-each-year
- Greater London Authority (8 March 2024). Air Quality in London 2016 to 2024. https://www.london.gov.uk/print/pdf/node/1272435
- Greater London Authority (March 2022). FOI: Air pollution in London before and after ULEZ charges. https://www.london.gov.uk/who-we-are/governance-and-spending/sharing-our-information/foi-disclosure-log/foi-air-pollution-london-and-after-ulez-charges-mar-2022
- Greater London Authority. New report reveals transformational impact of expanded Ultra Low Emission Zone so far. https://www.london.gov.uk/new-report-reveals-transformational-impact-expanded-ultra-low-emission-zone-so-far
- Energy Policy Institute at the University of Chicago. China’s air quality policies have swiftly reduced pollution, improved life expectancy. https://epic.uchicago.edu/insights/chinas-air-quality-policies-have-swiftly-reduced-pollution-improved-life-expectancy/
- Air Quality Life Index (September 2024). China Fact Sheet. https://www.ourenergypolicy.org/resources/air-quality-life-index-china-fact-sheet/
- Stronger policy required to substantially reduce deaths from PM2.5 pollution in China (2020). Nature Communications. https://www.nature.com/articles/s41467-020-15319-4
- World Health Organization (23 September 2024). Sustainable development goal indicator 3.9.1: mortality attributed to air pollution. https://www.who.int/publications/i/item/9789240099142
- World Health Organization. How air pollution is destroying our health. https://www.who.int/news-room/spotlight/how-air-pollution-is-destroying-our-health
- Clean Air Fund. Facts and stats on air pollution, citing UNEP. https://www.cleanairfund.org/theme/facts-and-stats/