

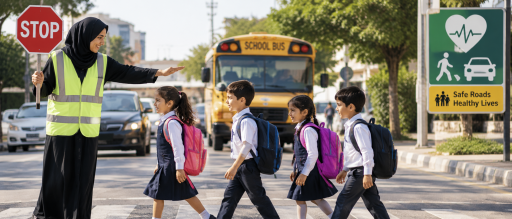
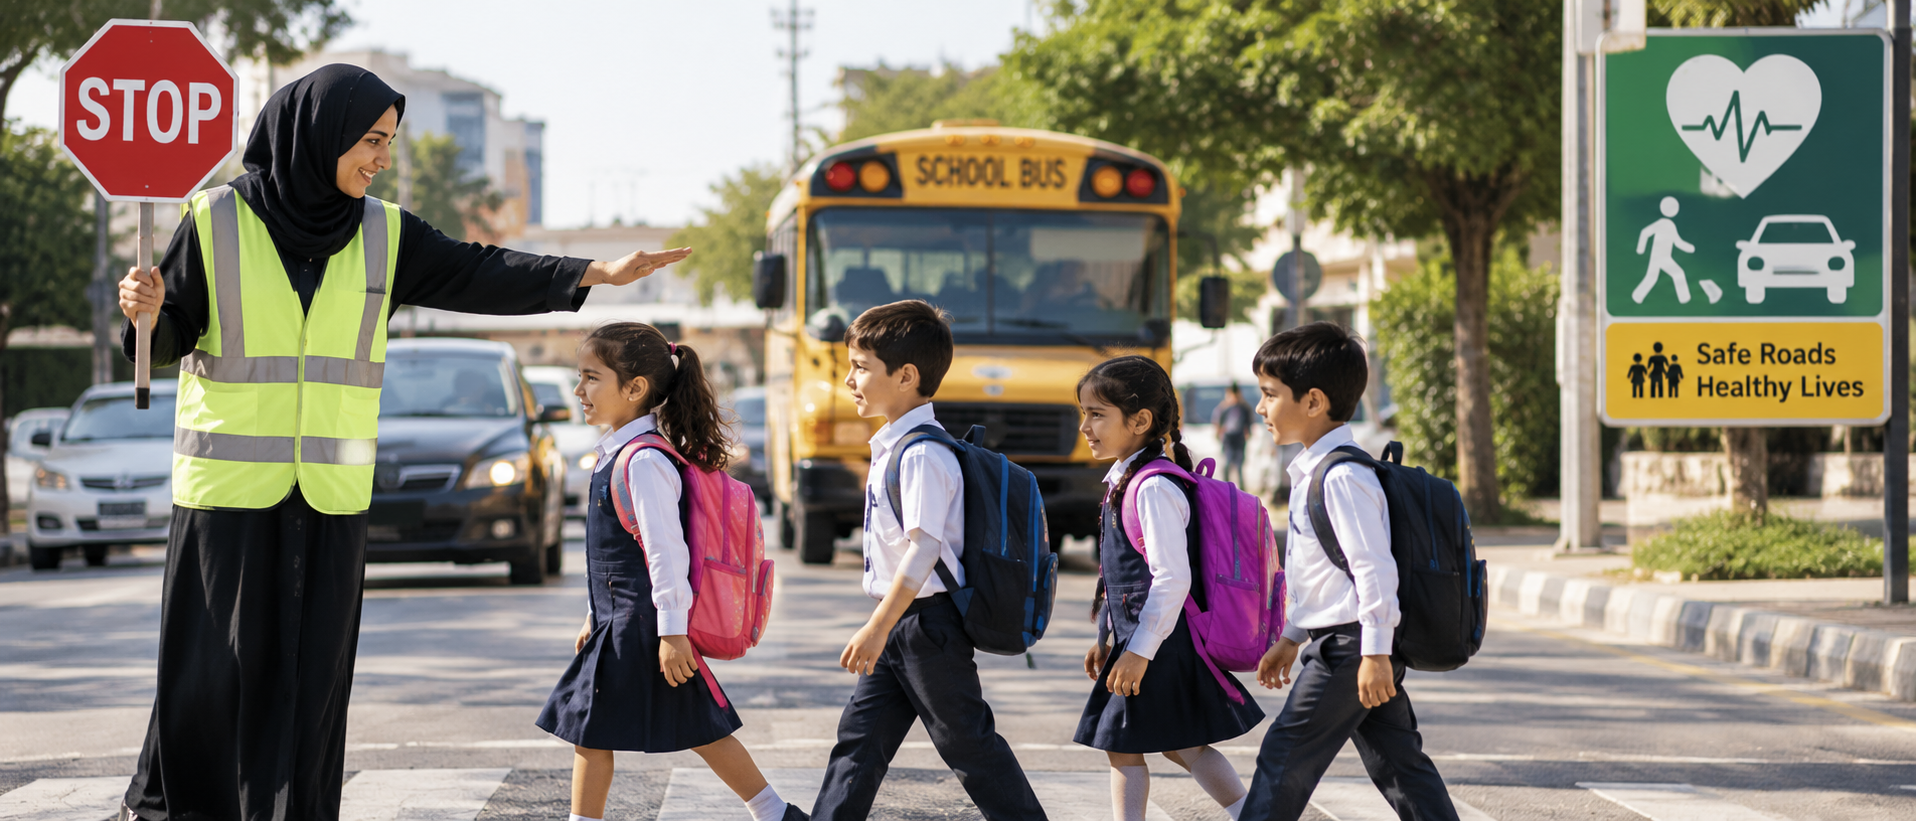
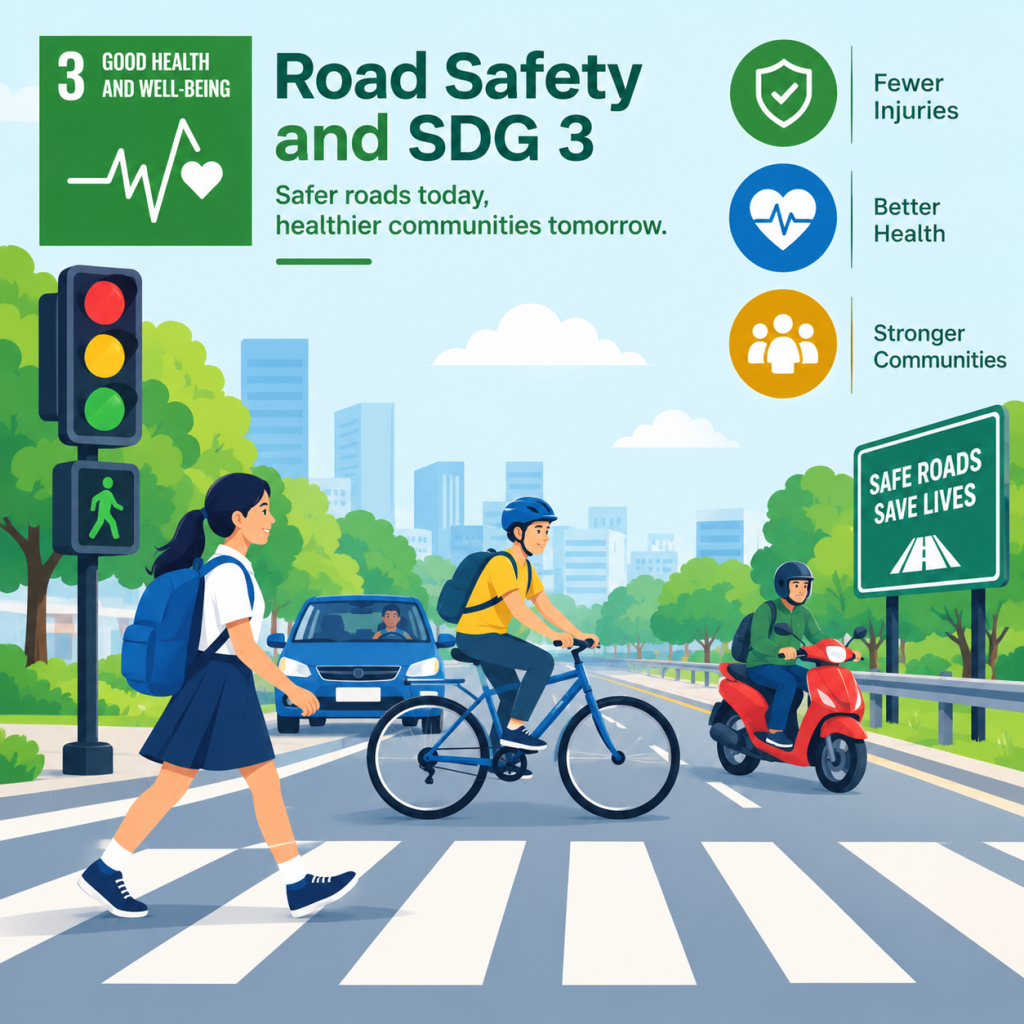
Most journeys end without incident. For more than a million people each year, they do not. Road safety is a core part of SDG 3, the global goal to ensure healthy lives and wellbeing for all.
Road traffic injuries are one of the largest public health challenges of our time. WHO reports that road traffic crashes claimed 1.16 million lives in 2025 [1]. They remain the leading cause of death for children and young adults aged 5 to 29 [2].
The damage reaches far beyond the crash scene:
- Individuals lose their lives, their health, or their ability to work.
- Families lose income, and relatives often take time off work or school to provide care [2].
- Communities lose people in their prime. Two thirds of road deaths occur among people aged 18 to 59 [2].
- Economies lose output. Road traffic crashes cost most countries about 3% of GDP [2].
SDG target 3.6 addresses this directly. It was set to halve global road traffic deaths and injuries by 2020, and the UN Decade of Action for Road Safety 2021 to 2030 carries the goal forward to 2030 [3]. In July 2026, UN member states adopted a new declaration aiming for a 50% cut in road deaths and serious injuries by 2030, compared with 2021 levels [1].
This article explains how traffic safety affects health, what drives crashes, and which policies, technologies, and business practices work. For wider context, see our overview of SDG 3: Good Health and Wellbeing.
Road Safety and Public Health
How crashes affect population health
Road traffic injuries shape population health in three ways.
- Deaths: About 1.16 million people die each year [1].
- Serious injuries and long term disability: Between 20 and 50 million more people suffer non fatal injuries, and many live with a disability [2].
- Psychological consequences: A 2025 meta analysis found that about 20% of road crash survivors develop post traumatic stress disorder [4].
These burdens are unevenly shared. More than 90% of road deaths occur in low and middle income countries [2].
Who faces the greatest risk
Some road users are far more exposed than others. WHO’s latest data shows that more than half of all road deaths are among pedestrians, cyclists, and motorcyclists [2].
- Pedestrians: About 274,000 died in 2021, and the number rose between 2010 and 2021 [5]. The risk of death for a pedestrian hit by a car front rises 4.5 times when speed increases from 50 to 65 km/h [2].
- Cyclists: Deaths rose by nearly 20% between 2010 and 2021, reaching about 71,000 [5].
- Motorcyclists: They now account for nearly a third of global road deaths, as motorcycle numbers more than tripled between 2011 and 2025 [1].
- Children and young people: Road crashes are the leading cause of death for ages 5 to 29 [2]. Child restraints cut deaths among infants by 71% [2].
Males are also about three times more likely than females to die in a crash [2].
Emergency care, rehabilitation, and long term care
Survival depends on what happens after impact. WHO notes that delays of minutes in care can separate life from death [2].
A strong response needs several links in the chain:
- Prehospital care: Fast detection and transport to a facility.
- Hospital trauma care: Trained staff and equipment.
- Rehabilitation: Recovery support so that injured people can return to work and school.
- Long term care: Ongoing support for people with lasting disabilities.
Hospital data can also reveal hidden harm. A study using Oslo University Hospital data found that between May and July 2019, four to five people were injured on e-scooters every day in Oslo, according to preliminary findings [6]. Police records alone under report such injuries [6].
The Economic Cost of Road Accidents
Who pays the bill
Road traffic injuries create costs at every level of society.
- Individuals and households: Medical bills, lost wages, and long term care costs.
- Businesses: Vehicle damage, insurance claims, lost working days, and reduced productivity.
- Governments: Emergency services, health care, rehabilitation, and lost tax revenue.
WHO explains that these losses come from the cost of treatment, from lost productivity among people killed or disabled, and from family members who take time off to provide care [2].
Household income and workforce participation
The age profile of victims makes the economic damage worse. Two thirds of road deaths occur among people of working age [2].
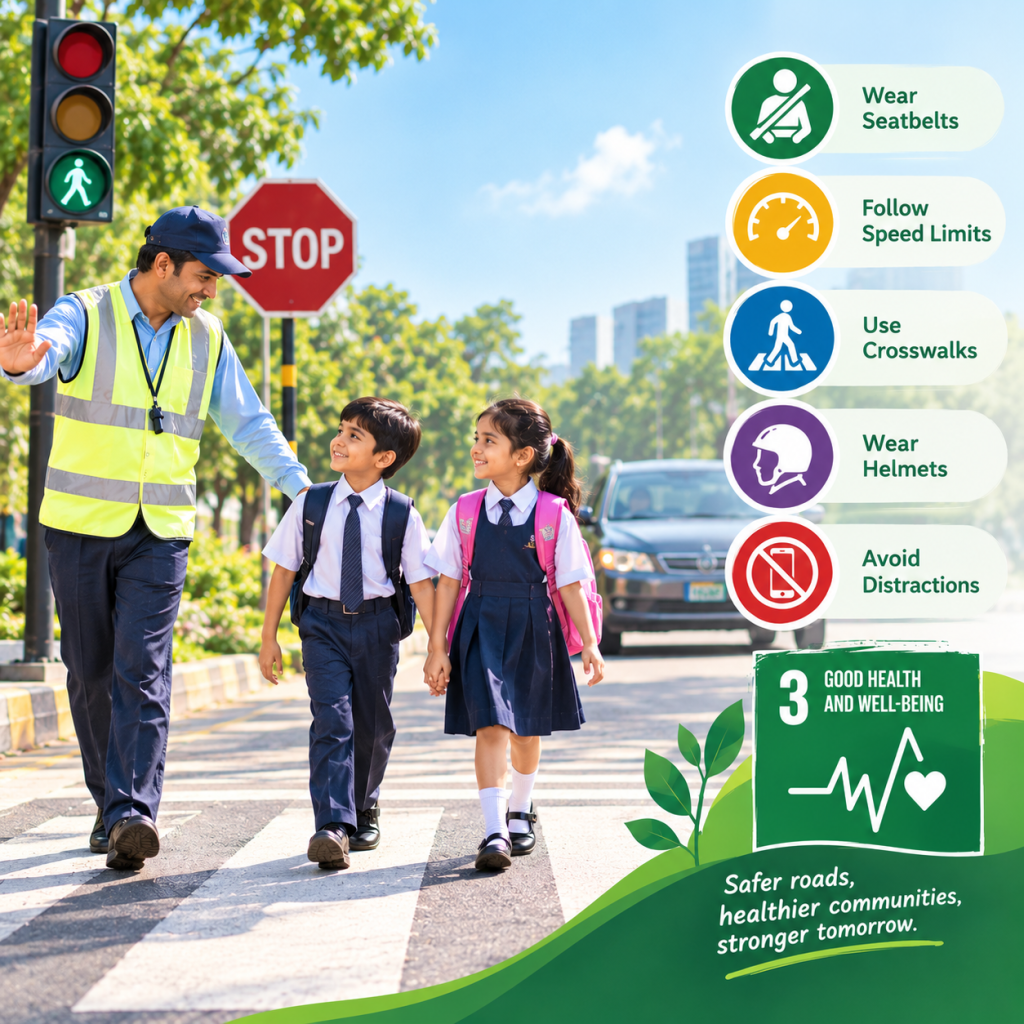
When a main earner dies or becomes disabled, household income can collapse overnight. Caregivers may also leave paid work. As a result, families can slip into poverty, and employers lose skilled workers.
What the evidence shows
Several documented estimates show the scale of the problem:
- WHO: Road crashes cost most countries about 3% of GDP [2].
- World Bank (2018): Halving road deaths and injuries could add 7% to 22% to GDP per capita over 24 years in five low and middle income countries studied. Broader welfare gains were estimated at 6% to 32% of GDP [7].
- Peer reviewed research: A study in The Lancet Planetary Health estimated the global macroeconomic cost of road injuries at about US$1.8 trillion over 2015 to 2030 [8].
- Norway (2016): Road crashes cost about EUR 1.65 billion, or 0.5% of GDP, excluding property damage [6].
That last point matters. Property damage is excluded from Norway’s estimate, so the true cost is higher.
Why safety investment builds resilience
Prevention protects incomes, workforces, and public budgets at the same time. In European PIN countries, the European Transport Safety Council estimates that deaths prevented between 2016 and 2025, compared with 2015 levels, were worth about EUR 77 billion [9]. Safer roads are therefore an economic resilience measure, not only a health measure.
Key Causes of Road Traffic Injuries
Major risk factors
WHO’s current data identifies six main drivers [2]:
- Speeding: Every 1% increase in average speed raises the risk of a fatal crash by 4% and a serious crash by 3%.
- Drink driving: Crash risk begins to rise at low blood alcohol levels and climbs sharply at 0.04 g/dl or above.
- Distracted driving: Drivers using mobile phones are about four times more likely to crash. Hands free phones are not much safer.
- No seat belts or helmets: Seat belts can cut the risk of death by up to 50%. Correct helmet use cuts the risk of death by more than six times.
- Unsafe road infrastructure: Missing footpaths, cycle lanes, and safe crossings expose vulnerable users.
- Poor vehicle safety: Vehicles without electronic stability control, airbags, or seat belts raise the risk for everyone.
More than individual mistakes
It is tempting to blame drivers alone. The evidence points to a wider system.
WHO promotes the safe system approach, which assumes people will make mistakes. It aims to design roads, speeds, and vehicles so that crash forces stay within survivable limits [1].
Norway shows why this matters. Excessive speed contributed to 40% of fatal crashes in 2019. However, Norwegian researchers found that the biggest drivers of the long decline in deaths were safer cars and lower average speeds. Median barriers and speed cameras also played a part [6].
How enforcement, infrastructure, and policy shape risk
- Enforcement: WHO warns that laws on speed, alcohol, belts, and helmets have little effect if people believe they will not be enforced [2].
- Infrastructure: Roads can be designed to reduce speed and separate users.
- Public policy: Standards, taxes, and national strategies set the conditions in which individuals make choices.
Infrastructure and Safer Transport
Design measures that save lives
Good road design prevents crashes and reduces their severity. Key measures include:
- Safe pedestrian crossings: Marked and protected points where people can cross safely [2].
- Protected cycling infrastructure: Separated lanes that keep cyclists apart from fast traffic [2].
- Speed limits and traffic calming: Lower limits, speed humps, and redesigned junctions.
- Safer school zones: Reduced speeds and limited vehicle access near schools.
- Street lighting: Better visibility for people walking and cycling after dark.
- Accessible public transport: Reliable options that reduce the number of vehicle trips. WHO also notes that more walking, cycling, and public transport use can improve air quality and ease congestion [1].
Protecting vulnerable road users
More than half of all road deaths involve people outside a car [1]. WHO argues that roads designed only around drivers leave these users dangerously exposed [1].
Protection therefore needs to be built into the design. Separation, lower speeds, and safe crossings do the most for pedestrians, cyclists, and riders.
Urban planning that reduces exposure
Cities can reduce risk by reducing exposure to fast traffic. Oslo offers documented evidence.
- Between 2015 and 2023, Oslo built 155 km of cycle lanes [10].
- Nearly 70% of its streets now have a speed limit of 30 km/h [10].
- It added traffic calming measures and “Heart Zones” around schools [10].
- Oslo recorded zero pedestrian and cyclist deaths in both 2019 and 2023 [10].
On Norway’s national roads, the road authority reported that 51.5% of national roads with speed limits of 70 km/h or more had median barriers as of January 2020 [6]. Barriers prevent head on crashes, which are among the deadliest.
Technology and Road Safety
Tools that help prevent crashes
Technology can reduce both the chance and the severity of a crash.
- Automatic emergency braking: Brakes the vehicle if the driver does not react to a likely collision.
- Driver assistance systems: Warnings for lane departure, blind spots, and fatigue.
- Speed monitoring: Cameras and section control that lower average speeds. Norwegian researchers list the increased use of speed cameras among the factors behind falling deaths [6].
- Intelligent traffic management: Signals and data systems that reduce conflicts at junctions.
- Vehicle safety technologies: Electronic stability control, airbags, and stronger structures.
- Digital systems for identifying high risk roads: Crash data and road assessments that show where to act first. Norway, for example, assesses national roads against minimum standards to prevent run off the road crashes [6].
A documented real world example: automatic emergency braking
The Insurance Institute for Highway Safety (IIHS) analysed police reported crashes in 22 US states between 2010 and 2014. It compared vehicles with and without front crash prevention [11].
- Automatic braking cut rear end crashes by about 40% on average.
- Forward collision warning alone cut them by 23% [11].
A broader IIHS analysis of passenger vehicles put the effect of automatic emergency braking at 50% for rear end crashes and 56% for rear end injury crashes [12]. For pickups, rear end crash rates fell by more than 40%. Pedestrian crashes fell by 27%, although the systems were less effective at night [12].
Benefits and limitations
Technology works, but it is not a complete answer.
- Benefit: Systems act faster than human reaction time and work in every journey.
- Limit 1: Adoption is slow. Only 26.3% of Norwegian cars had automatic emergency braking in 2019 [6].
- Limit 2: Test scenarios can be narrow. IIHS researchers note that low speed rear end crashes similar to its test protocol make up under 3% of police reported front to rear crashes [13].
- Limit 3: Performance varies by situation. For pedestrians, for example, the systems are less effective at night [12].
For this reason, technology works best alongside safe roads, safe speeds, and enforced laws.
Government Policies and Road Safety
Policies that reduce deaths and injuries
Governments hold the most powerful levers. Key road safety policies include:
- Traffic law enforcement: Norway’s police stepped up patrols and focused on large speed violations. The share of vehicles within the speed limit rose to 62.1% in 2019, up 16.5% since 2006 [6].
- Drink driving regulations: Norway’s legal limit is 0.2 g/l, or 0.02%. Even so, alcohol was a factor in 8% of fatal crashes in 2019, and drugs, or alcohol combined with drugs, in another 12% [6].
- Seat belt and helmet laws: Front seat belts have been compulsory in Norway since 1975, and rear seat belts since 1985. Drivers’ belt use is now about 97% to 98% [6]. Helmet wearing among riders of motorised two wheelers is close to 100% [6].
- Vehicle safety standards: WHO points to UN vehicle regulations, including electronic stability control, airbags, and seat belts in all vehicles [2].
- Speed management: Lower limits in residential and urban areas, supported by design.
- Road safety education: Norway’s road authority has run campaigns aimed at young male drivers [6].
- Emergency response systems: Timely prehospital and hospital care. WHO lists inadequate post crash care as a major risk factor for worse outcomes [2].
Why laws need enforcement and safe roads
A law on paper does not change behaviour. People comply when they see consistent enforcement and when roads make safe behaviour easy.
For example, a speed limit works best on a road designed for that speed. That is why WHO calls for action across roads, vehicles, and road users together [2].
The importance of national strategies
Coordination matters. The July 2026 UN declaration commits countries to national road safety strategies with clear targets, timelines, and budgets. It also calls for lead road safety agencies, better data, stronger legislation, and vehicle and infrastructure standards [1].
Norway shows what this looks like in practice. Its road authority coordinates with police, health, education, counties, and cities under a shared long term strategy. The 2018 to 2021 action plan alone listed 13 priority areas and 136 measures [6].
A Case Study
Norway’s Vision Zero Approach
What problem was Norway facing?
Norway faced the challenge that many countries share. Traffic grew by 42% between 2000 and 2019, while deaths needed to fall [6]. In 2000, Norway recorded 7.6 road deaths per 100,000 people [6].
Which policies and interventions were introduced?
Norway’s Parliament adopted Vision Zero in 2001. The approach covers all transport modes and focuses on preventing crashes that cause death or serious injury [6].
Highest priority goes to head on crashes, run off the road crashes, and collisions with pedestrians and cyclists. Special attention goes to young drivers, older road users, and motorcyclists [6].
Targets are explicit. The national transport plan aims for no more than 350 people killed or seriously injured by 2030 [6].
What role did infrastructure, enforcement, and technology play?
- Infrastructure: Median barriers, safer road design, and investment in walking and cycling routes.
- Enforcement: Stepped up police patrols, more speed cameras, and campaigns that lifted belt use and speed compliance [6].
- Technology: Researchers named growing use of safety features in cars as one of the two biggest explanations for the decline in deaths. The other was lower average speeds [6].
What measurable results were reported?
- 2000 to 2019: Annual road deaths fell by 68%. The death rate dropped 73%, from 7.6 to 2.0 per 100,000 people [6].
- Per distance travelled: Deaths per billion vehicle kilometres were 78% lower in 2019 than in 2000 [6].
- 2024: Norway had 16 road deaths per million inhabitants, the lowest among 32 European countries. It received the 2025 ETSC Road Safety Performance Index Award [14].
- 2025: Norway and Sweden were again Europe’s safest, each with 19 deaths per million, against an EU average of 43 [9].
What limitations or criticisms exist?
Norway’s record is strong, but it is not flawless.
- Cyclists benefited least. Their deaths fell 53% between 2000 and 2019, compared with more than 72% for car occupants and pedestrians [6].
- Deaths rose in 2025. Preliminary figures show 111 deaths, up from 87 in 2024. They included 11 cyclists, 10 pedestrians, and about 25 people on motorcycles and mopeds [15].
- Serious injuries are still too high. The road authority estimated more than 600 deaths and serious injuries in 2025, against the 2030 target of no more than 350 [15].
- Data gaps remain. Serious injury data are hard to validate, and minor crashes and single bicycle crashes are under reported [6].
- Speed still matters. It contributed to 40% of fatal crashes in 2019 [6].
Norway’s lesson is balanced. Sustained, system wide effort cut deaths dramatically, yet progress needs constant attention, especially for vulnerable users.
Measuring Progress Toward SDG 3
How road safety contributes to SDG 3
Road safety is tracked under target 3.6 through indicator 3.6.1, the death rate due to road traffic injuries [3]. WHO is the custodian agency for this indicator [3].
What the global numbers show
According to the UN’s 2026 SDG report [3]:
- Global road deaths fell 5.5% from 1.25 million in 2010 to 1.18 million in 2021.
- The global death rate fell 17%, from 18 to 15 per 100,000 people.
- The rate was lowest in Australia and New Zealand, at 5 per 100,000, followed by Europe and Northern America at 9.
- Central and Southern Asia, and Eastern and South Eastern Asia, had the highest regional rates at 16.
- Low income countries had a rate of 21, compared with 8 in high income countries.
- The male rate was about three times the female rate, at 22 against 7.
WHO’s new 2025 data adds a more recent view. The global rate of road traffic deaths fell 21% between 2011 and 2025, despite more than one billion extra vehicles [1].
Global and country level comparison
Country results diverge sharply. Norway recorded about 1.6 deaths per 100,000 in 2024 [14], compared with a global rate of 15 in 2021 [3].
Regional trends also differ. In the decade to 2021, deaths fell 36% in the WHO European Region and 15% in the Western Pacific. They fell 2% in South East Asia, and rates did not change in the Americas. Deaths rose 17% in the African Region [1]. Ten countries cut road deaths by 50% in that decade [1].
What the figures indicate about the 2030 target
The target is a 50% reduction by 2030 against 2021 levels [1]. The UN says the current pace is insufficient to reach it [3].
The EU shows the same gap. Road deaths there are down 15% since 2019, while a 31% reduction was needed to stay on course [9]. In short, progress is real but too slow.
How governments measure traffic deaths and serious injuries
- Deaths: Under the definition used by IRTAD members such as Norway, a road death is any death within 30 days of a crash [6].
- Serious injuries: These are harder to count. Police data under report many cases, and Norway does not yet classify injuries using hospital data [6].
- Risk indicators: Governments also track speed compliance, belt wearing, and helmet use, as Norway does [6].
Why falling death rates do not mean everyone is safer
Averages can hide risk. Between 2010 and 2021, overall deaths fell slightly, yet pedestrian deaths rose and cyclist deaths rose by nearly 20% [5].
The same pattern appears in Norway, where cyclists gained the least [6]. A falling national rate is good news, but safety must be measured for each type of road user.
What Businesses Can Do
Practical actions for safer roads
Businesses can reduce risk for employees, contractors, and communities without replacing government action. Effective measures include:
- Fleet safety policies: Clear standards for vehicles, routes, and driver behaviour.
- Driver training: Practical training focused on speed, hazards, and vulnerable road users.
- Vehicle maintenance: Regular inspections of brakes, tyres, and lights.
- Fatigue management: Limits on driving hours, rest breaks, and night work. Fatigue contributed to 26% of fatal crashes in Norway in 2019 [6].
- Seat belt policies: Mandatory belt use in every company vehicle.
- Safe delivery schedules: Delivery windows that do not require speeding.
- Employee commuting safety: Safer transport options, shuttle services, and support for helmets and protective gear.
- Appropriate vehicle safety technology: Automatic emergency braking and driver monitoring in new fleet purchases.
Why unrealistic deadlines raise risk
Time pressure is a road safety issue. Tight delivery deadlines and long working hours push drivers to speed and drive tired.
Speed has a clear effect. Every 1% rise in average speed lifts fatal crash risk by 4% [2]. Fatigue adds to the danger.
The risk is growing. WHO links the tripling of motorcycles to ride hailing and delivery apps, and notes that safe helmets cut the risk of death by more than six times [1]. The July 2026 UN declaration also urges the private sector to prioritise road safety throughout supply chains [1].
Monitoring performance
You cannot manage what you do not measure. Useful indicators include:
- Incidents per million kilometres driven.
- Near misses and harsh driving events.
- Speed compliance across the fleet.
- Seat belt and helmet use.
- Share of vehicles passing inspections without serious faults.
Norway applies the same logic nationally. Its action plan tracks the share of vehicles within speed limits and belt use rates as core indicators [6].
Connecting safety to sustainable business
Road safety links directly to sustainable business practices. It protects employees, supports operational resilience, and strengthens the social side of ESG performance. For related ideas, see our posts on employee wellbeing and corporate sustainability and sustainable supply chain management.
Conclusion
Road safety is an essential part of achieving SDG 3. The evidence is clear that road traffic deaths and injuries are preventable.
Safer roads protect vulnerable users. Responsible driving, effective legislation, and better vehicle technology cut risk further. Together, they reduce preventable deaths and injuries.
These measures also support healthier communities and economic resilience. Safer streets keep workers earning, children in school, and health systems less stretched. Walkable, well designed cities also support more sustainable transport.
The trend shows both progress and urgency. The global death rate fell 21% between 2011 and 2025, yet 1.16 million people still died in 2025 [1]. Norway proves that deep reductions are possible, while its 2025 setback shows that vigilance is needed [15].
Governments, businesses, and communities share responsibility. Governments set standards and fund safe infrastructure. Businesses manage fleets, schedules, and supply chains responsibly. Communities demand safer streets and follow the rules. Meeting the 2030 target depends on all three acting together.
References
- World Health Organization (20 July 2026). Road deaths fall by 21% globally but stronger action is needed to save lives. https://www.who.int/news/item/20-07-2026-road-deaths-fall-by-21–globally-but-stronger-action-is-needed-to-save-lives
- World Health Organization (20 July 2026). Road traffic injuries, fact sheet. https://www.who.int/news-room/fact-sheets/detail/road-traffic-injuries
- United Nations Statistics Division (2026). The Sustainable Development Goals Extended Report 2026, Goal 3, Indicator 3.6.1. https://unstats.un.org/sdgs/report/2026/extended-report/Extended-Report-2026_Goal-3.pdf
- Systematic review and meta analysis of the prevalence of post traumatic stress disorder in road traffic accident survivors (2025). PubMed. https://pubmed.ncbi.nlm.nih.gov/41356737/
- World Health Organization (13 December 2023). Despite notable progress, road safety remains urgent global issue. https://www.who.int/news/item/13-12-2023-despite-notable-progress-road-safety-remains-urgent-global-issue
- International Transport Forum, OECD. Road Safety Country Profile: Norway (IRTAD). https://www.itf-oecd.org/sites/default/files/norway-road-safety.pdf
- World Bank (2018). The High Toll of Traffic Injuries: Unacceptable and Preventable. https://www.globalroadsafetyfacility.org/publications/high-toll-traffic-injuries-unacceptable-and-preventable
- The global macroeconomic burden of road injuries: estimates and projections for 166 countries (2019). The Lancet Planetary Health. https://www.thelancet.com/journals/lanplh/article/PIIS2542-5196(19)30170-6/fulltext
- European Transport Safety Council (June 2026). 20th Annual Road Safety Performance Index (PIN) Report. https://etsc.eu/20th-annual-road-safety-performance-index-pin-report/
- Transport for London. Achieving Vision Zero, Case study: Road safety in Oslo. https://content.tfl.gov.uk/vision-zero-case-study-oslo.pdf
- Insurance Institute for Highway Safety. Front crash prevention slashes police reported rear end crashes. https://www.iihs.org/news/detail/front-crash-prevention-slashes-police-reported-rear-end-crashes
- Insurance Institute for Highway Safety. Autobrake slashes rear end crash rates for pickups, but few are equipped. https://www.iihs.org/news/detail/autobrake-slashes-rear-end-crash-rates-for-pickups-but-few-are-equipped
- Characteristics of automatic emergency braking responses in passenger vehicles evaluated in the IIHS front crash prevention program. Accident Analysis and Prevention. https://www.sciencedirect.com/science/article/abs/pii/S0001457523001975
- European Transport Safety Council (June 2025). 19th Road Safety Performance Index Report, Norway wins the 2025 PIN Award, as reported by CITA. https://citainsp.org/2025/06/24/etsc-publishes-its-19th-pin-report/
- Xinhua (2 January 2026). Traffic deaths in Norway spike in 2025, citing the Norwegian Public Roads Administration. https://english.news.cn/20260102/52c070685b904e3c8f371aef42a3bf7a/c.html